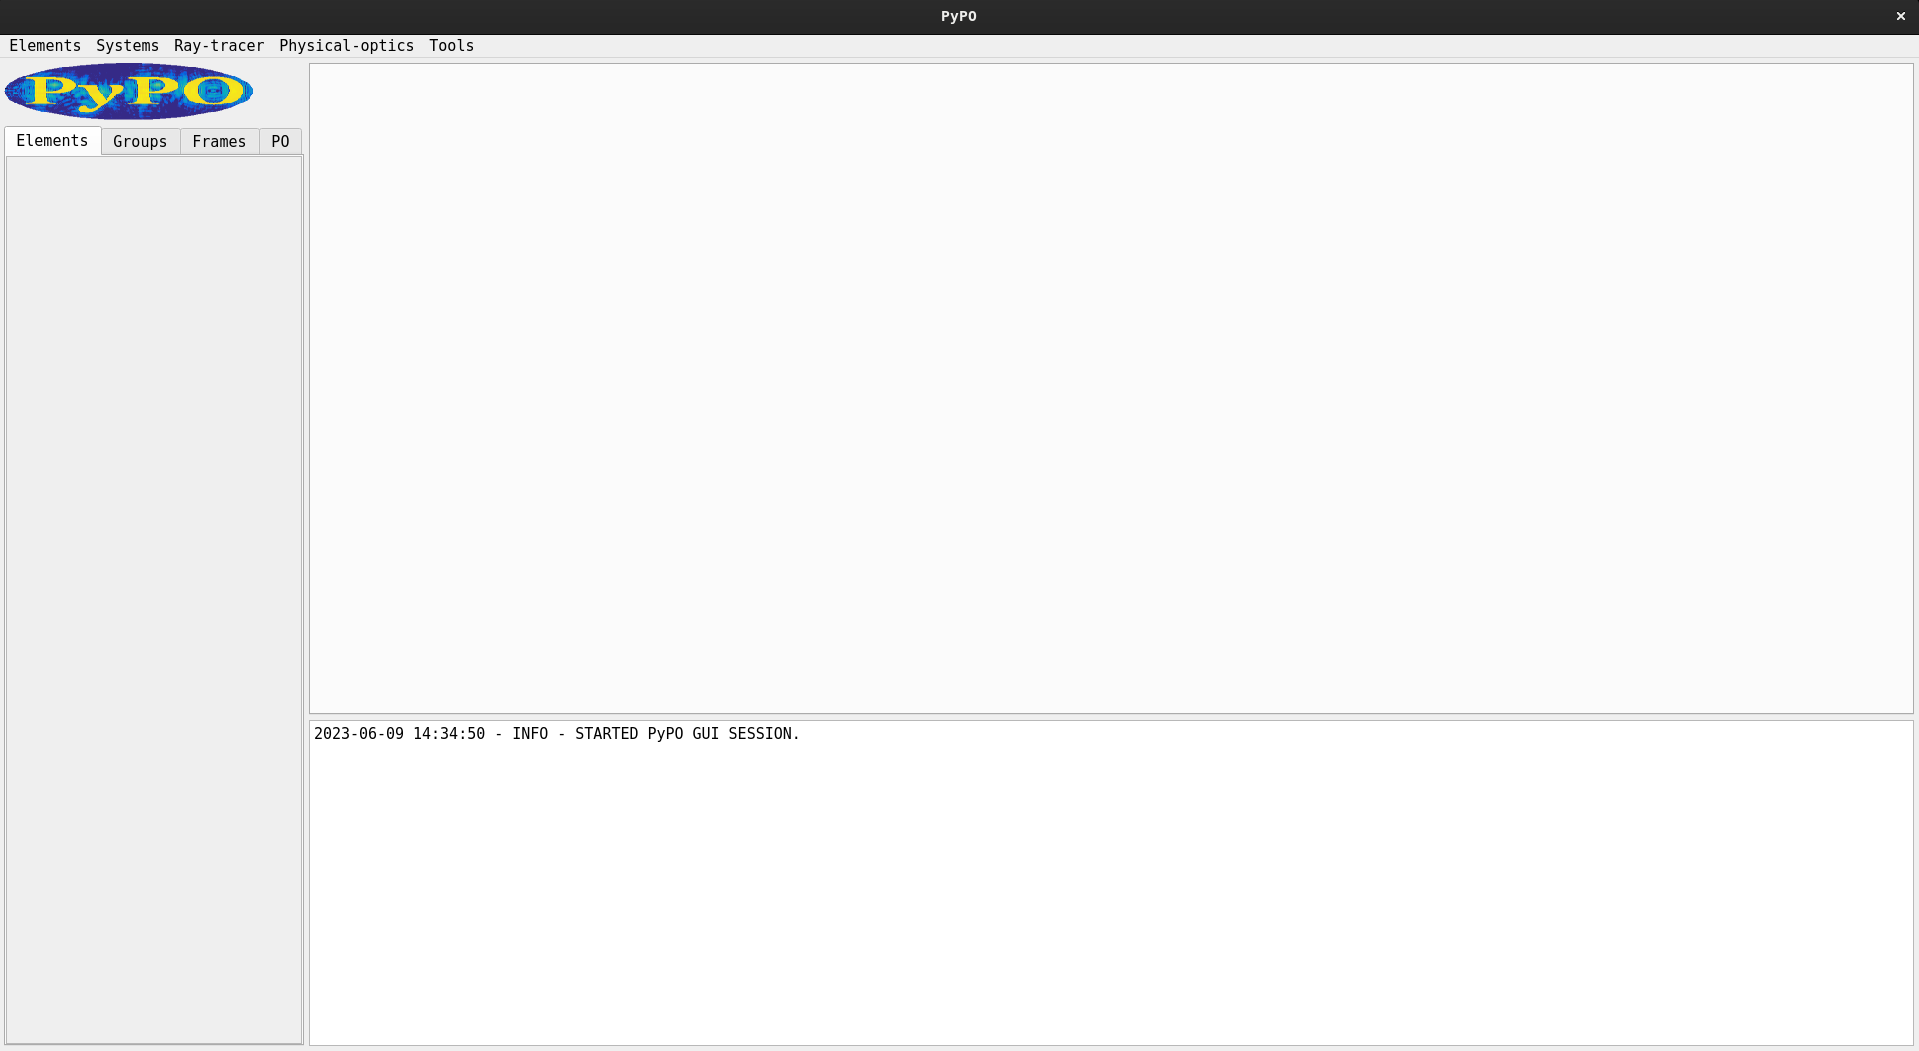
Before we can use the GUI, we have to start it up. The GUI can only
ben used if PyPO is installed from source because the GUI
source code is only included if directly obtained from Github. Also make
sure that PySide6, pyqtdarktheme and attrs are installed, otherwise the
GUI will not launch:
pip install PySide6 pyqtdarktheme attrsNavigate to the location of the PyPO root directory and
run:
python GuiApp.pywhich should launch the GUI.
In this tutorial we will, step by step, build a simple reflector system and perform a ray-trace calculation trough it.
The gui consists of 3 widgets:
For most interactions a form will show up next to the workspace.

From the elements menu select Add Reflector > Quadric surface.
A form will show up with a dropdown selector. Click the button that displays “–Select item–”. You can choose between three different quadric geometries. Upon clicking a geometry, a new form pops up, containing a bunch of parameters. By filling in the parameters and clicking add, a reflector has been added to the system. If successful, a widget will show up in the workspace as such:
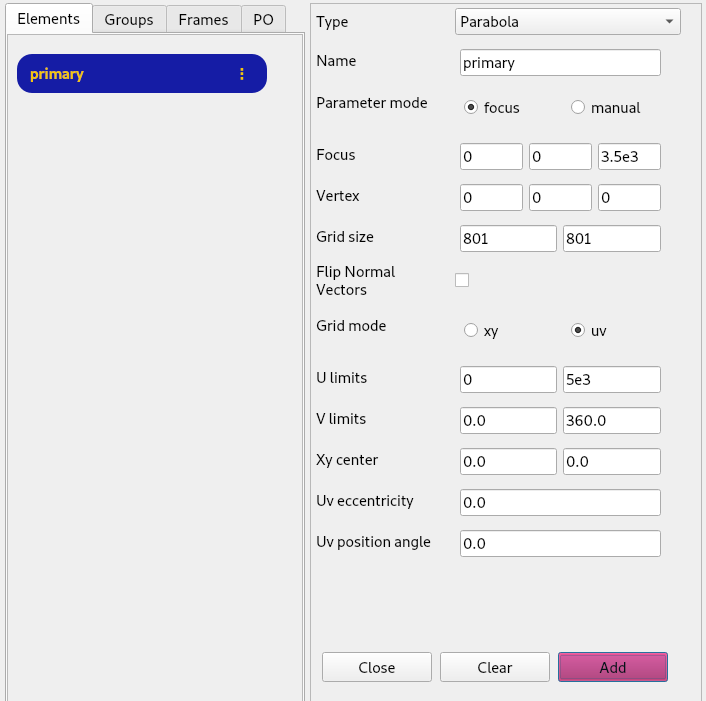
If adding the reflector did not succeed a message will be logged in the console with information about what went wrong.

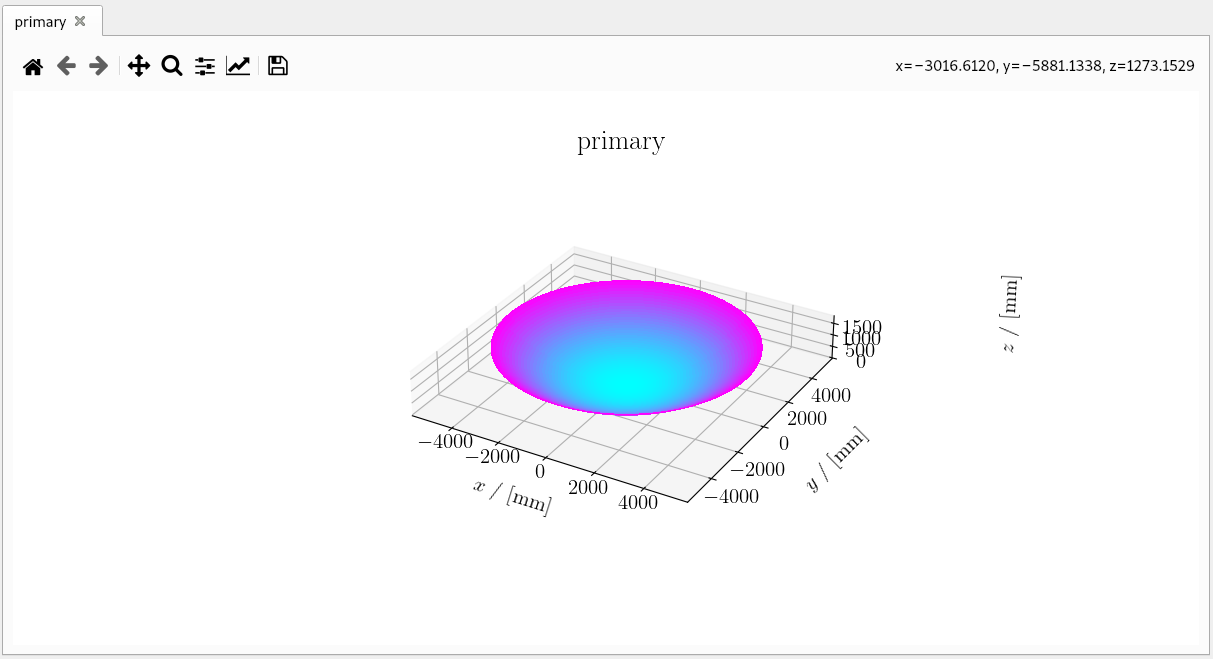
To inspect the reflector we just defined, we need to plot it. By clicking on the three dots on the right side of the element widget the element options menu will open. The first option is plot.
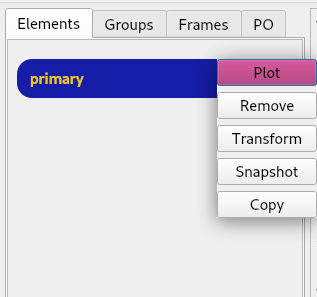
This will show the plot on the plot screen.
Now we will define a ray-trace frame. We can do that from the menu bar by selecting Ray-trace > Make frame > Tube.
Again, a form will show up. We fill it with the following parameters.
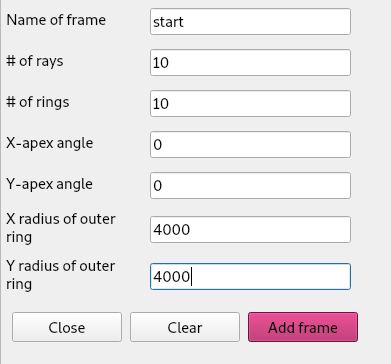
When the frame is added, a widget will show up in the Frames tab of the workspace. By clicking plot in the frame options menu we are presented with a form that allows us to choose the plane in which we want to plot this frame. If we select x and y we get the following plot.
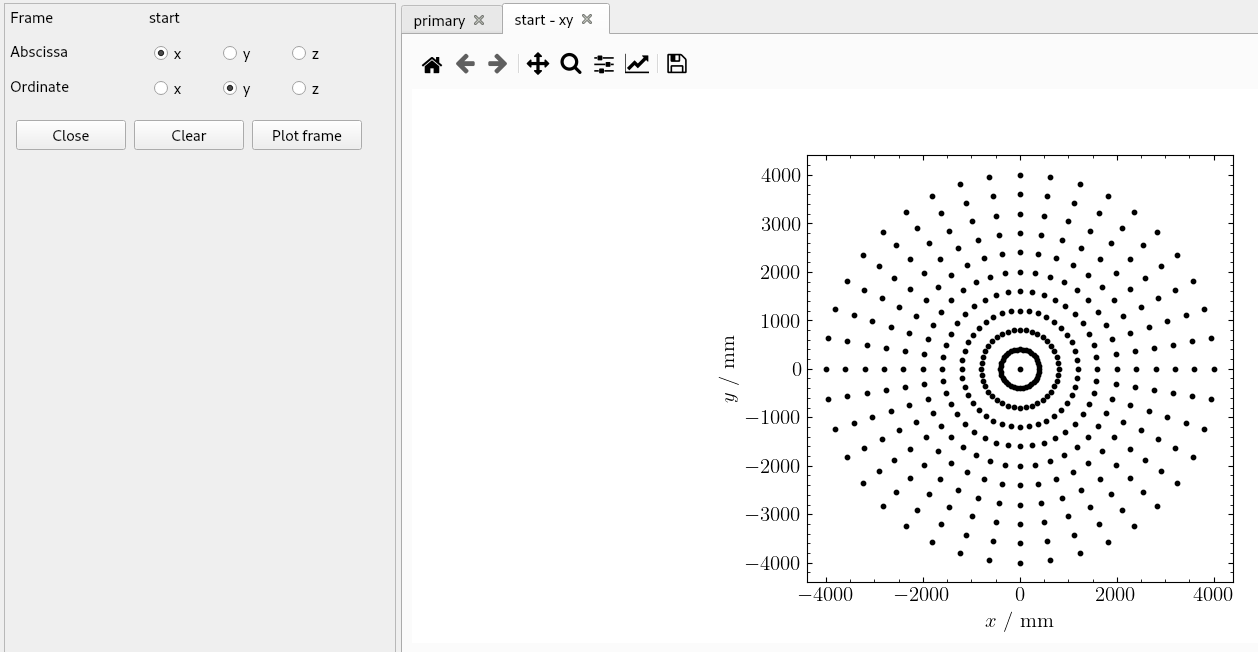
Now we can see that we have defined a frame on the xy plane with z co-ordinate equal to 0 mm. We can translate this frame upwards by selecting the transform option from the frame options as shown below
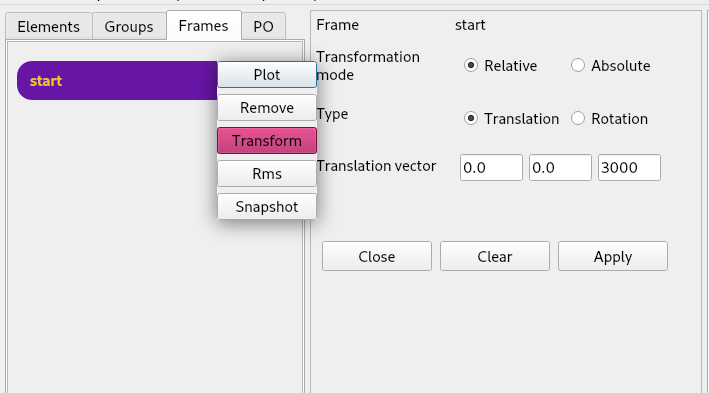
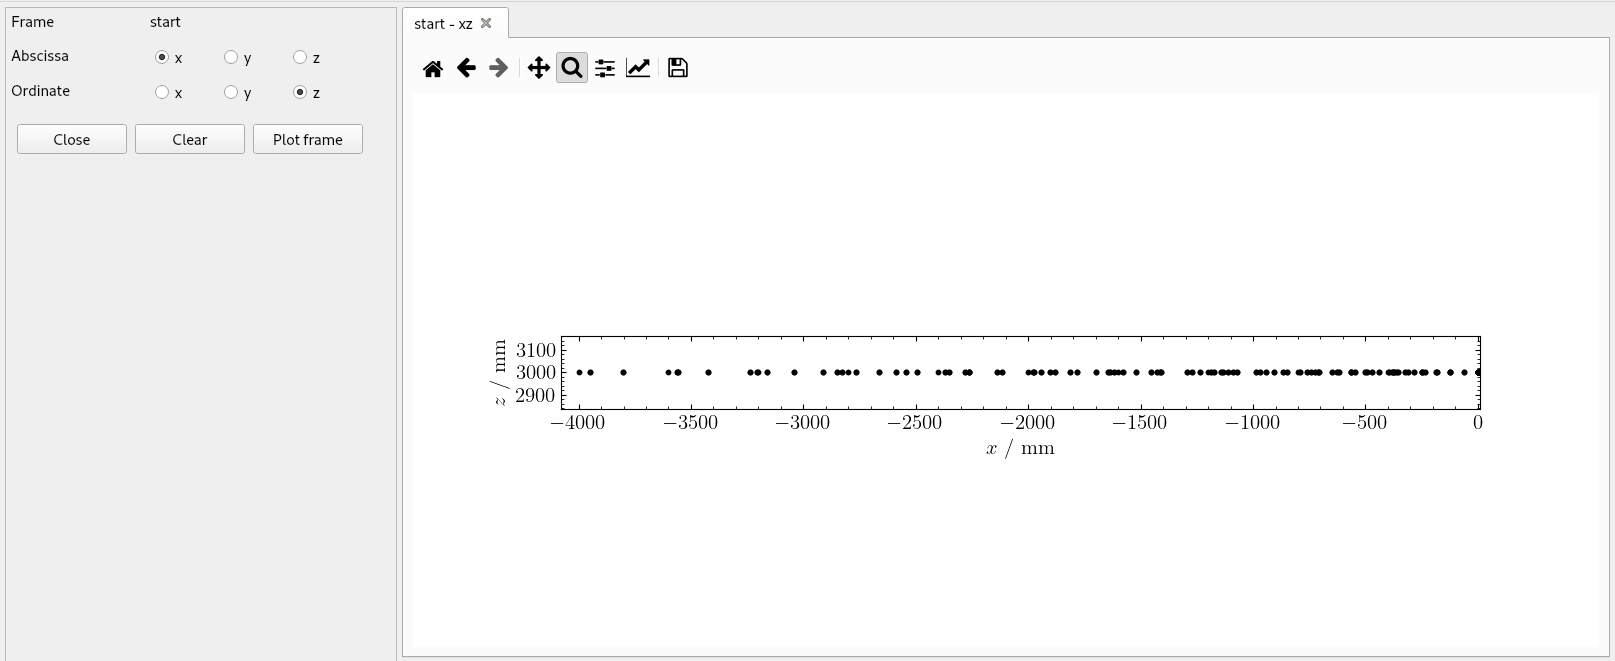
Now, if we plot the frame again from the side (e.g. in the xz-plane) we can see if the translation was succesful. After zooming in with the zoom tool in the plot, we can see that all of the points have z coordinate equal to 3000 mm and the translation was succesful.
We can propagate the rays of the frame we just created by clicking Ray trace > Propagate Rays. Again, a form will show up. We fill it with these parameters:
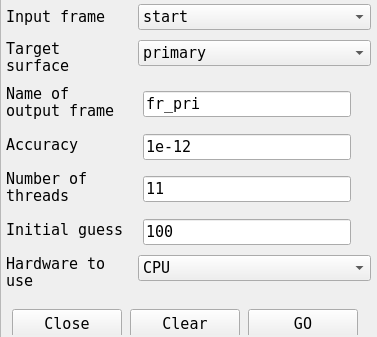
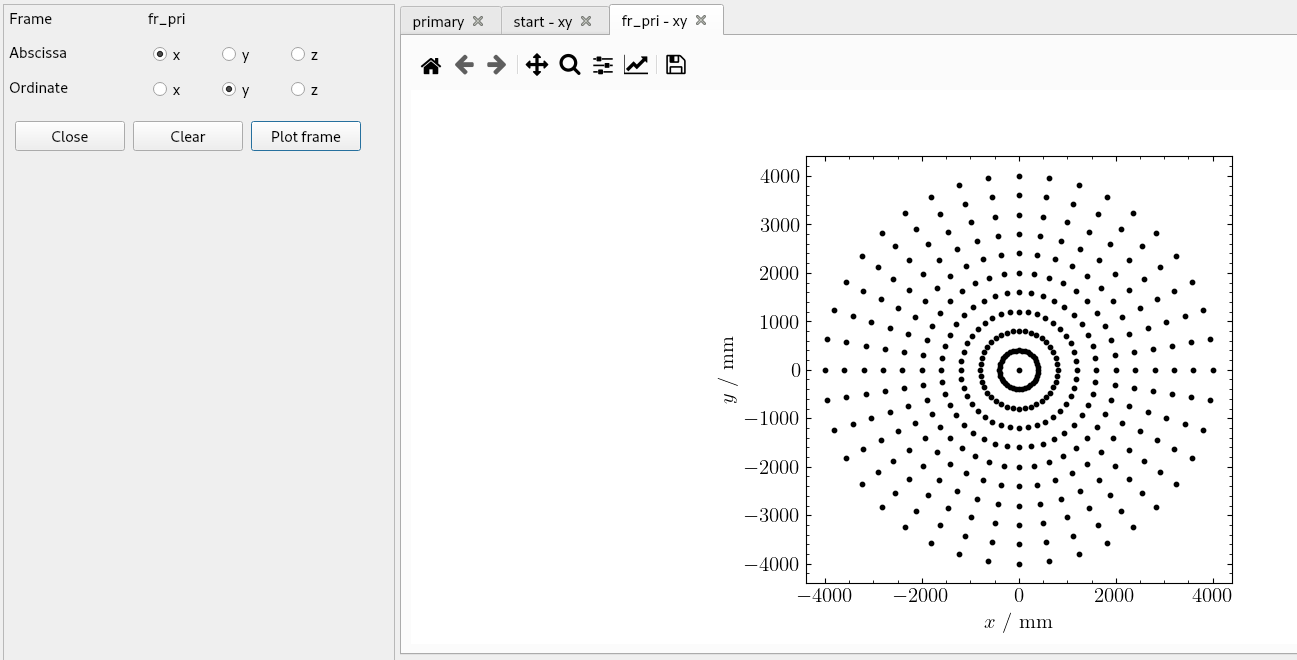
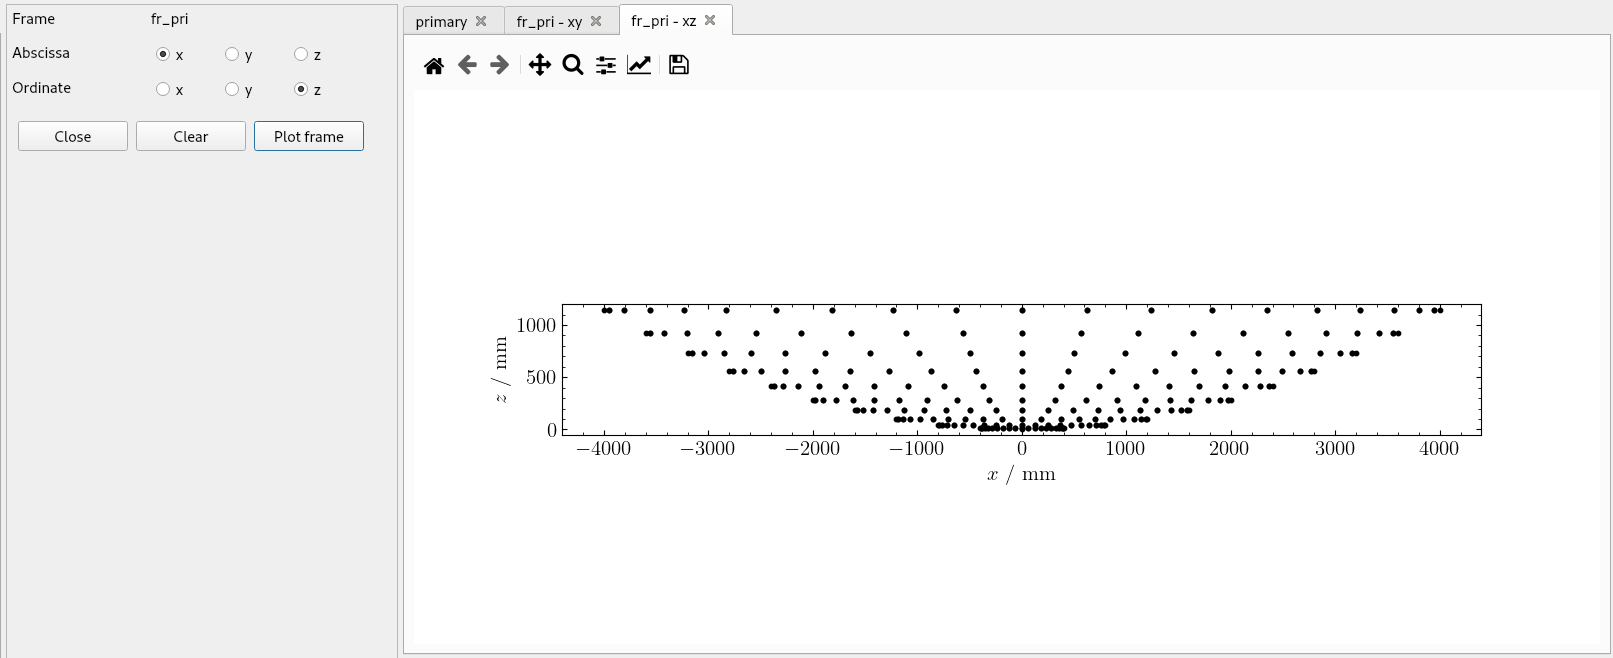
This will create a new frame fr_pri. If we plot this frame in the xy-plane, it will look exactly the same as the previous frame. But looking from the side (e.g. plotting in the xz-plane) we can see that the points have been projected onto the paraboloid.
After the rays are propagated onto the paraboloid reflector, they can
be propagated to the focus of the reflector. We could do this by
remembering that we supplied the focus as one of the generating
parameters of the paraboloid, but PyPO contains a tool for
this, if the focus is not known: the focus finder.
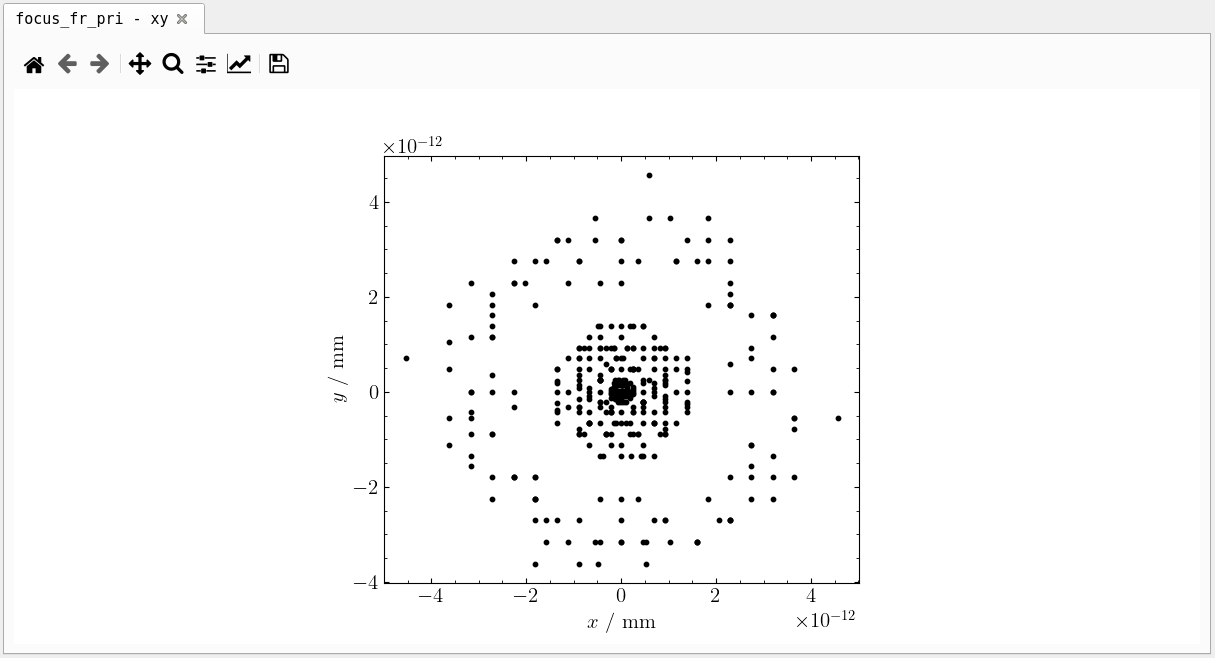
in the menubar we select Tools > Focus finder. Then we select the frame we want to find the focus of and click Find focus. This will automatically generate a new frame. If we plot this frame in xy we see that the numbers along the axes are very small. The frame has been propagated to the focal plane using the tool.
